Transparent Track Record
Every Gold Call. Wins & Losses.
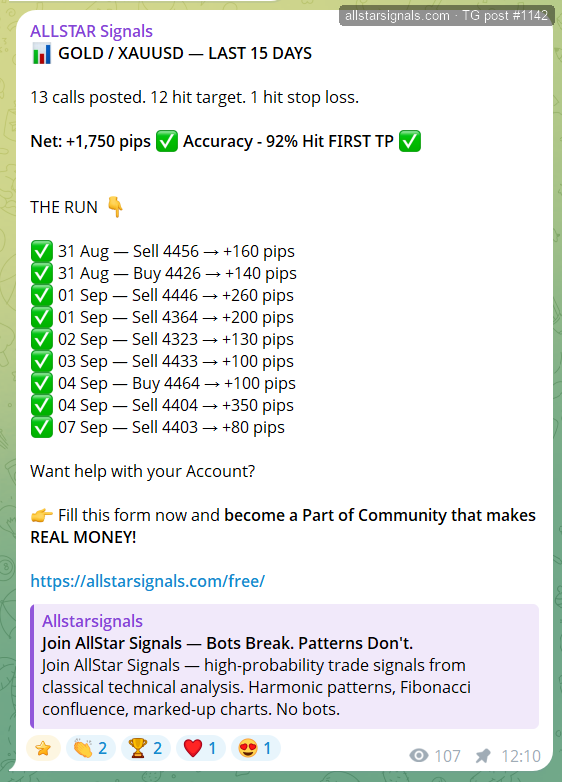
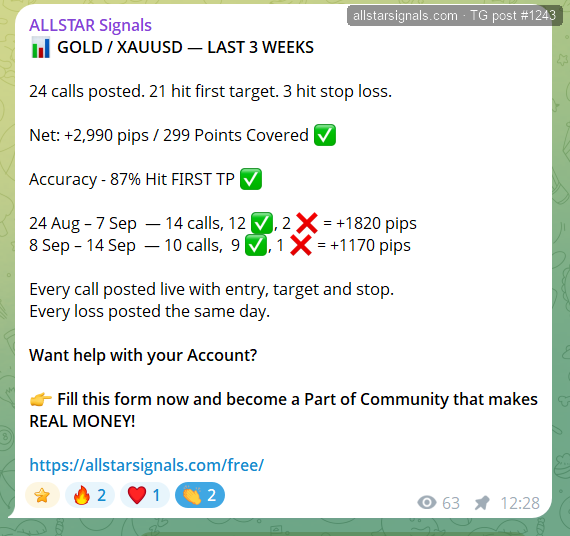
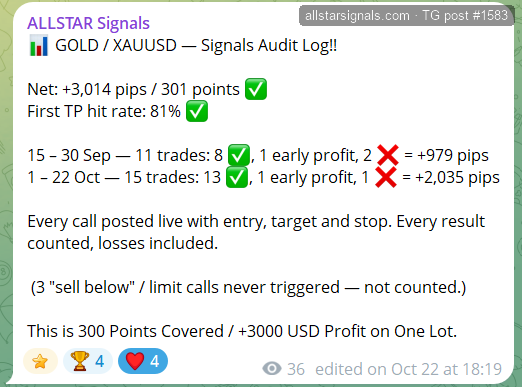
Every gold (XAUUSD) call posted in our Telegram channel from 24 Aug to 22 Oct 2026 — all 55 of them, the stop losses included. Each row carries its post number, so you can find the original message in the channel and check it yourself.
First Target Hit
84%
42 of 50 trades
Net Result
+5,784 pips
50 trades, losses included
Stop Losses Hit
6
all 6 shown below
Avg Win / Avg Loss
+147 / −115
pips per trade
| Period | Trades | Result | Pips |
|---|---|---|---|
| 24 Aug – 7 Sep 2026 | 14 | 12 ✓, 2 ✗ | +1,640 |
| 8 – 14 Sep 2026 | 10 | 9 ✓, 1 ✗ | +1,170 |
| 15 – 30 Sep 2026 | 11 | 8 ✓, 1 early profit, 2 ✗ | +974 |
| 1 – 22 Oct 2026 | 15 | 13 ✓, 1 early profit, 1 ✗ | +2,000 |
| Total | 50 | 42 ✓, 2 early profit, 6 ✗ | +5,784 |
As posted in the channel
Every call
| Date | Post | Dir | Entry | Targets | Stop | Result | Pips | Note |
|---|---|---|---|---|---|---|---|---|
| 22 Oct | #1578 | SELL | 4,096 | 4,090 / 4,080 | 4,108 | ALL TARGETS | +160 | Both targets reached |
| 21 Oct | #1569 | SELL | 4,124 | 4,116 / 4,105 | 4,135 | FIRST TP | +80 | First target (msg 1573) |
| 20 Oct | #1565 | SELL | 4,121 | 4,112 / 4,100 | 4,133 | EARLY PROFIT | +50 | Part profit at 4116 (msg 1566) |
| 20 Oct | #1559 | SELL | 4,118 | 4,110 / 4,100 | 4,132 | STOP LOSS | -140 | No result was posted; counted as a stop loss |
| 19 Oct | #1550 | SELL | 4,183 | 4,175 / 4,165 | 4,193 | FIRST TP | +80 | First target (msg 1555) |
| 16 Oct | #1542 | SELL | 4,187 | 4,175 / 4,155 | 4,202 | FIRST TP | +220 | Full 220 pips (msg 1544) |
| 15 Oct | #1531 | SELL | 4,157 | 4,147 / 4,130 | 4,172 | ALL TARGETS | +300 | 300 pips (msg 1535) |
| 15 Oct | #1525 | SELL | 4,148 | 4,138 / 4,125 | 4,160 | FIRST TP | +100 | First target (msg 1526) |
| 14 Oct | #1518 | SELL | 4,149 | 4,140 / 4,130 | 4,164 | ALL TARGETS | +190 | Final target (msg 1521) |
| 14 Oct | #1512 | SELL | 4,158 | 4,150 / 4,135 | 4,171 | FIRST TP | +80 | First target (msg 1514) |
| 13 Oct | #1503 | SELL | 4,186 | 4,178 / 4,168 | 4,196 | ALL TARGETS | +180 | Final target (msg 1509) |
| 12 Oct | #1491 | SELL | 4,220 | 4,208 / 4,190 | 4,232 | FIRST TP | +120 | No result was posted; scored against gold price data |
| 07 Oct | #1451 | SELL | 4,129.51 | 4,121 / 4,105 | 4,138 | NOT TRIGGERED | not counted | Sell-below entry; no update |
| 07 Oct | #1439 | SELL | 4,140 | 4,130 / 4,120 | 4,152 | FIRST TP | +100 | First target (msg 1448) |
| 06 Oct | #1434 | SELL | 4,129 | 4,120 / 4,110 | 4,140 | NOT TRIGGERED | not counted | Sell-below entry; no update |
| 05 Oct | #1420 | SELL | 4,167 | 4,155 / 4,140 | 4,180 | ALL TARGETS | +280 | Final target, 280 pips (msg 1428) |
| 01 Oct | #1398 | BUY | 4,160 | 4,170 / 4,180 | 4,150 | ALL TARGETS | +200 | Final target, 200 pips (msg 1402) |
| 29 Sep | #1379 | SELL | 4,140 | 4,135 / 4,125 | 4,148 | STOP LOSS | -80 | No result was posted; scored against gold price data |
| 28 Sep | #1365 | BUY | 4,164 | 4,174 / 4,185 | 4,154 | STOP LOSS | -100 | No result was posted; scored against gold price data |
| 25 Sep | #1357 | SELL | 4,269 | 4,260 / 4,250 | 4,280 | FIRST TP | +90 | First target hit (msg 1358) |
| 23 Sep | #1333 | SELL | 4,278 | 4,270 / 4,250 | 4,282 | NOT TRIGGERED | not counted | Sell-below entry; no update |
| 23 Sep | #1331 | SELL | 4,319 | 4,310 / 4,300 | 4,330 | ALL TARGETS | +190 | Final target hit (msg 1334) |
| 23 Sep | #1326 | SELL | 4,328 | 4,320 / 4,310 | 4,338 | ALL TARGETS | +180 | Final target, +180 (msg 1329/1330) |
| 22 Sep | #1317 | SELL | 4,340 | 4,330 / 4,315 | 4,352 | ALL TARGETS | +250 | 250 pips (msg 1318) |
| 21 Sep | #1308 | SELL | 4,349.41 | 4,340 / 4,320 | 4,361 | FIRST TP | +94 | Target (msg 1311) |
| 21 Sep | #1290 | BUY | 4,342 | 4,352 / 4,360 | 4,335 | EARLY PROFIT | +70 | Secured 70 pips at 4349 (msg 1296) |
| 17 Sep | #1263 | SELL | 4,302 | 4,290 / 4,270 | 4,316 | FIRST TP | +120 | First target, 120 pips (msg 1264) |
| 15 Sep | #1249 | SELL | 4,283 | 4,275 / 4,260 | 4,292 | FIRST TP | +80 | No result was posted; scored against gold price data |
| 15 Sep | #1246 | SELL | 4,270 | 4,262 / 4,250 | 4,280 | FIRST TP | +80 | No result was posted; scored against gold price data |
| 14 Sep | #1234 | SELL | 4,292 | 4,285 / 4,275 | 4,300 | ALL TARGETS | +170 | Final target hit, +170 (msg 1237) |
| 11 Sep | #1218 | SELL | 4,351 | 4,342 / 4,325 | 4,365 | ALL TARGETS | +250 | +250 pips, both TP done (msg 1224) |
| 11 Sep | #1215 | SELL | 4,330 | 4,320 / 4,300 | 4,342 | FIRST TP | +100 | 100 pips (msg 1216) |
| 10 Sep | #1208 | SELL | 4,363 | 4,350 / 4,335 | 4,373 | NO RESULT POSTED | not counted | Entry moved to CMP 4363; no result posted |
| 10 Sep | #1203 | SELL | 4,404 | 4,398 / 4,390 | 4,412 | ALL TARGETS | +140 | Final target matched (msg 1205) |
| 10 Sep | #1196 | SELL | 4,418 | 4,410 / 4,400 | 4,428 | FIRST TP | +80 | 80 pips first target (msg 1197) |
| 09 Sep | #1186 | SELL | 4,425 | 4,416 / 4,400 | 4,434 | ALL TARGETS | +250 | Full 250 pips (msg 1189) |
| 09 Sep | #1183 | BUY | 4,415 | 4,430 / 4,440 | 4,400 | FIRST TP | +150 | 4430 +150 pips (msg 1185) |
| 09 Sep | #1181 | SELL | 4,395 | 4,390 / 4,380 | 4,403 | FIRST TP | +50 | First target hit (msg 1182) |
| 09 Sep | #1174 | SELL | 4,382 | 4,370 / 4,365 | 4,396 | STOP LOSS | -120 | This HIT SL (msg 1175); day wrap -120 |
| 08 Sep | #1164 | BUY | 4,395 | 4,405 | 4,385 | FIRST TP | +100 | 4405 +100 pips, target achieved (msg 1167) |
| 07 Sep | #1152 | SELL | 4,387 | 4,380 / 4,370 | 4,398 | STOP LOSS | -110 | Stop revised 4398; This HIT SL (msg 1154) |
| 07 Sep | #1150 | SELL | 4,397 | 4,390 / 4,380 | 4,409 | NO RESULT POSTED | not counted | No result posted |
| 07 Sep | #1139 | SELL | 4,403 | 4,398 / 4,390 | 4,410 | FIRST TP | +80 | First TP done, 80 pips (msg 1141) |
| 04 Sep | #1128 | SELL | 4,404.51 | 4,395 / 4,370 | 4,414 | ALL TARGETS | +350 | 4370!! +350 pips |
| 04 Sep | #1121 | BUY | 4,464 | 4,475 / 4,480 | 4,452 | FIRST TP | +100 | +100 pips, first TP done |
| 03 Sep | #1101 | SELL | 4,433 | 4,423 / 4,417 | 4,443 | FIRST TP | +100 | First TP done +100 |
| 02 Sep | #1079 | SELL | 4,323 | 4,315 / 4,310 | 4,336 | ALL TARGETS | +130 | Both TP done +130 (msg 1081) |
| 02 Sep | #1072 | SELL | 4,304 | 4,294 / 4,280 | 4,314 | STOP LOSS | -140 | This HIT SL (msg 1074), stop revised 4318 |
| 01 Sep | #1061 | SELL | 4,364 | 4,358 / 4,345 | 4,371 | ALL TARGETS | +200 | Closing the day +200 pips |
| 01 Sep | #1043 | SELL | 4,446 | 4,434 / 4,420 | 4,455 | ALL TARGETS | +260 | 260 pips covered (msg 1054) |
| 31 Aug | #1040 | BUY | 4,426 | 4,433 / 4,440 | 4,416 | ALL TARGETS | +140 | Final target hit next morning |
| 31 Aug | #1035 | SELL | 4,456 | 4,448 / 4,440 | 4,463 | ALL TARGETS | +160 | Final target hit, all TP matched |
| 31 Aug | #1029 | SELL | 4,421 | 4,414 / 4,401 | 4,430 | FIRST TP | +70 | First target matched |
| 27 Aug | #1021 | SELL | 4,600 | 4,590 / 4,580 | 4,612 | ALL TARGETS | +200 | 200 Pips achieved |
| 27 Aug | #1013 | SELL | 4,638 | 4,630 / 4,620 | 4,648 | ALL TARGETS | +100 | Both targets matched |
How we count: 1 pip = $0.10 on gold. Entry is the first price in the call. Pips are the figure the channel posted for that call, or entry to the furthest target reached. A trade counts as a win once it hits its first target; after that the stop moves to breakeven. 5 of the 55 calls are listed but not counted: 3 “sell below” calls that never triggered, and 2 with no result ever posted. Where a result was not posted but price clearly resolved the trade, we scored it against price data and say so in the note — that includes 2 of the stop losses. Past results do not guarantee future returns. Trading involves risk.
Check it yourself: the channel is open to everyone who asks. Request access on Telegram and scroll back to any post number above.
Check it yourself: the channel is open to everyone who asks. Request access on Telegram and scroll back to any post number above.